
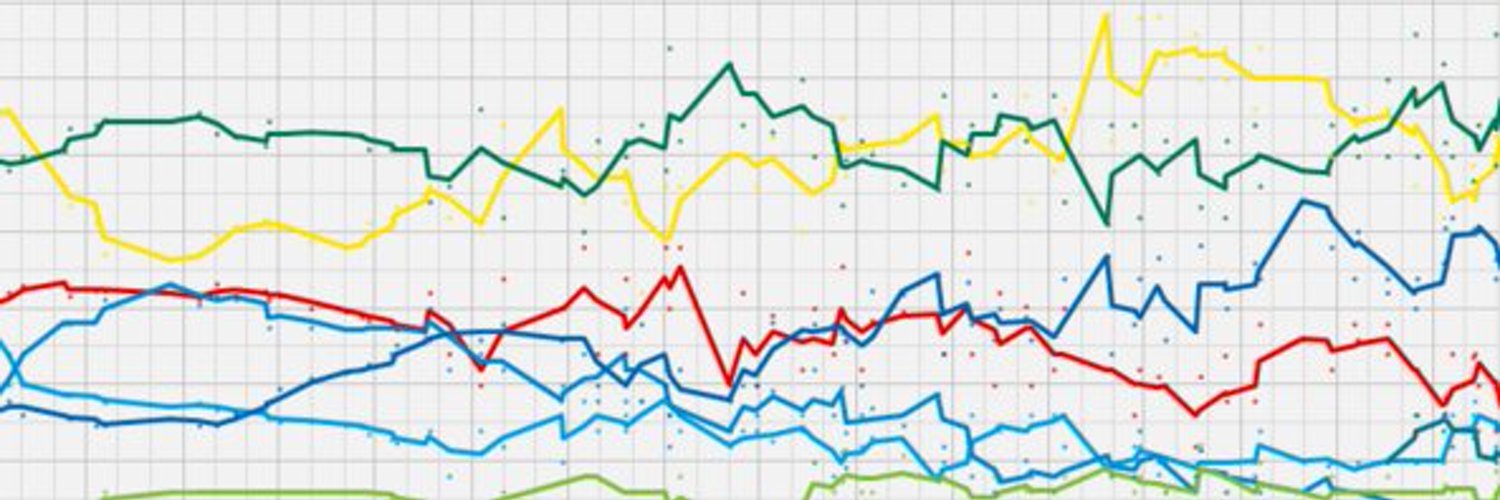
Arizona's July 21 Primary
From the PollingSource daily briefing for July 16, 2026
Arizona's July 21 Primary
Arizona voters go to the polls on July 21 to set the field for governor and House races, with the Arizona governor's race the marquee contest on the ballot. The general election currently carries a Likely D rating, but that classification describes the fall matchup, not the primary itself, and the primary result will be the first real test of how durable that lean is once actual candidates — rather than generic partisan assumptions — are on the ballot. Primaries in a state rated Likely D are not typically treated as high suspense events by national handicappers, but the composition of the nominee field and the margins within each party's contest can still move expectations. A weak showing by a well-funded candidate, or an unexpectedly strong protest vote, tends to get cited in subsequent rating reviews even when the top-line label doesn't change right away. Turnout patterns will also be scrutinized against Arizona's recent primary history, since sluggish turnout in one party's contest relative to the other is often read as an early proxy for enthusiasm heading into November. None of that is dispositive on its own, but it's the kind of data point analysts will be pulling within days of polls closing.
The Toss-up Tier: Florida and Nebraska
Two governor's races currently sit at the most competitive rating on the board. The Florida governor's race and the Nebraska governor's race are both rated Toss-up, placing them in a category that, by definition, offers no presumptive edge to either party. That two states with such different political profiles and electorates land in the same tier is itself a reminder that national environment alone doesn't dictate outcomes — state-specific dynamics, candidate quality, and local issue sets are doing real work in both contests. Toss-up ratings are also the most volatile on the board; they tend to move on new polling, fundraising disclosures, and debate performances more readily than Lean or Likely races, which have more institutional inertia built into their classifications. Anyone tracking the national map for signs of which party has the wind at its back in 2026 should treat Florida and Nebraska as the two most sensitive instruments available — small shifts here will register faster than anywhere else on the board.
The Lean Tier: Kansas, Iowa, and North Carolina
A second cluster of races sits one notch off Toss-up. The Kansas governor's race is rated Lean R, while the Iowa governor's race and the North Carolina governor's race are both rated Lean D. Lean ratings occupy an awkward middle ground: they signal a real but not overwhelming advantage, and history shows they flip to Toss-up or harden into Likely with roughly comparable frequency depending on how the cycle develops. Kansas is notable as the only Lean R among this group, making it something of an outlier worth isolated attention if Republican prospects nationally either strengthen or soften over the summer. Iowa and North Carolina, both Lean D, will be useful paired data points — if one moves while the other holds steady, that's a signal of state-specific dynamics; if both move in tandem, that points toward something more structural in the national environment.
The Likely Tier: A Broader Baseline
Rounding out the map, several races carry Likely ratings in one direction or the other. The New Hampshire governor's race is rated Likely R, while the Michigan governor's race, the Minnesota governor's race, and the Georgia governor's race are each rated Likely D. Likely ratings are not immune to change, but they require more sustained movement to shift categories than Lean or Toss-up races do, and they typically serve as the floor and ceiling markers for each party's overall standing on the governors' map. Four Likely D races alongside a single Likely R contest gives a rough sense of the current baseline shape of gubernatorial competition heading into the second half of the year, though baseline is not destiny — several of these races were rated differently at this point in prior cycles before tightening or diverging as campaigns progressed.
Taken together, the ten races outlined here span the full range of the competitiveness scale, from Toss-up to Likely in both directions, and Arizona's primary result next week will be the first concrete data point to test whether any of these classifications are due for a second look.